
Daily Market Analysis and Forex News
Mid-Week Technical Outlook: Pivot Points & Fibonacci Retracements

Global stocks edged cautiously higher on Wednesday as investors braced for the latest Federal Reserve meeting minutes.
It’s been an eventful week for markets thus far, with global growth fears, inflation jitters and ongoing geopolitical risks influencing sentiment. In the currency arena, euro bulls dominated the scene while the dollar stabilised after two consecutive days of losses. Oil benchmarks rose on Wednesday, lifted by tight supplies and prospects of the summer driving season in the United States boosting demand. There was little action in gold which traded within a tight range.
With the various themes pulling and tugging at risk sentiment, this could present fresh opportunities across the FX space. Today, we will use pivot points, Fibonacci retracement and moving averages among other technical tools to uncover potential setups on various currency pairs.
A pivot point is a technical analysis indicator used to determine the overall trend of the market over different timeframes. Pivot points have predictive qualities, so it is considered a leading indicator to traders. The FXTM pivot point indicator can be downloaded HERE.
A Fibonacci retracement is a technical analysis tool, used to gain insight into where possible support and resistance levels may occur. For more information on Fibonacci, click HERE.
GBPUSD above weekly pivot
The GBPUSD has turned bullish on the daily charts. Prices are trading above the weekly pivot level and have already hit the weekly R1 level. A strong daily close above the weekly R1 could encourage an incline towards the weekly R2 based at 1.2718. Should 1.2718 prove to be a tough nut to crack, a decline back to 1.2410 could become reality.

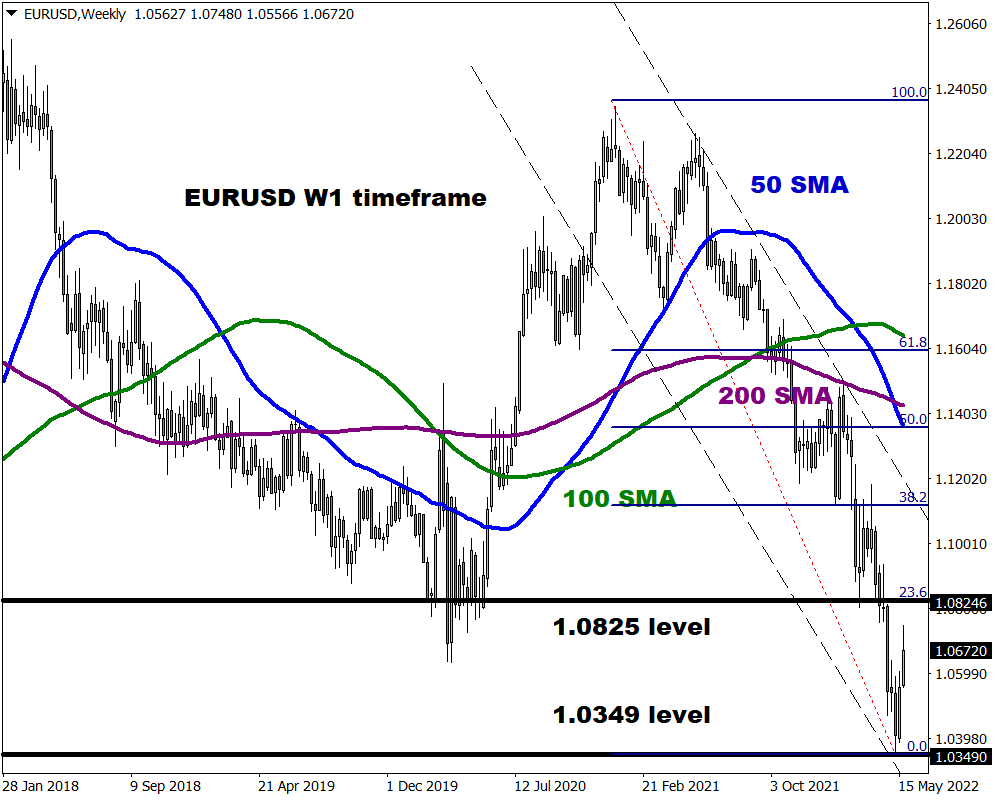
EURUSD to test 23.6% Fibonacci?
Earlier in the week we questioned whether the EURUSD was in the process of a technical rebound or just another “dead cat bounce”.
Euro bulls were powered by fundamental drivers and improving economic data with prices hitting 1.0748. While prices remain bearish on the weekly charts, a retracement back towards the weekly 23.6% Fibonacci level at 1.0825 could be on the cards. This resistance could provide bears a foundation to drag prices lower towards 1.0500 and lower.
EURGBP eyes weekly R2
After securing a solid daily close above the weekly R1 level at 0.8525, bulls seem to be eyeing the R2 level at 0.8600.
Technical indicators favour further upside as prices are trading above the 50, 100 and 200-day Simple Moving Average while the MACD trades to the upside. Strong support can be found at the 200-day SMA which is just below the weekly pivot level at 0.8456. A move below this level could signal the end of the daily bull trend with 0.8384 acting as a point of interest.

GBPJPY to resume downtrend?
The GBBJPY looks to resume its downtrend after pulling back from the 38.2% Fibonacci retracement level. Prices remain bearish on the daily charts as there have been consistently lower lows and lower highs while the MACD trades to the downside. A strong breakdown below the 23.6% Fibonacci level of 158.60 could inspire a selloff towards 155.50 where the 200-day Simple Moving Average resides. Should prices push back above 160.50, an incline towards 162.00 could become reality.

Commodity spotlight – Gold
It feels like gold may be waiting for a fresh directional catalyst before making its next big move. Prices have failed to conquer the weekly R1 level of $1867.1 and could head back to the pivot found at $1827.14. This decline could be accelerated by an appreciating dollar and hawkish Fed minutes. Alternatively, a move above $1867.1 could trigger an incline towards $1889.95.

Ready to trade with real money?
Open accountChoose your account
Start trading with a leading broker that gives you more.