
Daily Market Analysis and Forex News
2023 Predictions: Mid-year Scorecard

What an eventful first half it’s been.
Coming into 2023, no one would’ve expected a banking crisis on either side of the Atlantic (recall how SVB and Credit Suisse collapsed), nor being a whisker away from a civil war in Russia.
But traders and investors have taken things in stride, weathering bouts of volatility and uncertainty.
Back on January 4th, I wrote this article: “3 potential winners in 2023”.
Here’s a mid-year report card on those 3 assets:
1) Gold to hit $2000?
Yes. $2k target hit on March 20th.
Of course, spot gold needed the help of an unexpected banking crisis in the US and Europe to send investors scurrying towards the safe haven asset.
But after coming to within 0.57% or about $12 away from its record high ($2074.87 on 7th August 2020), gold has crumbled since May.
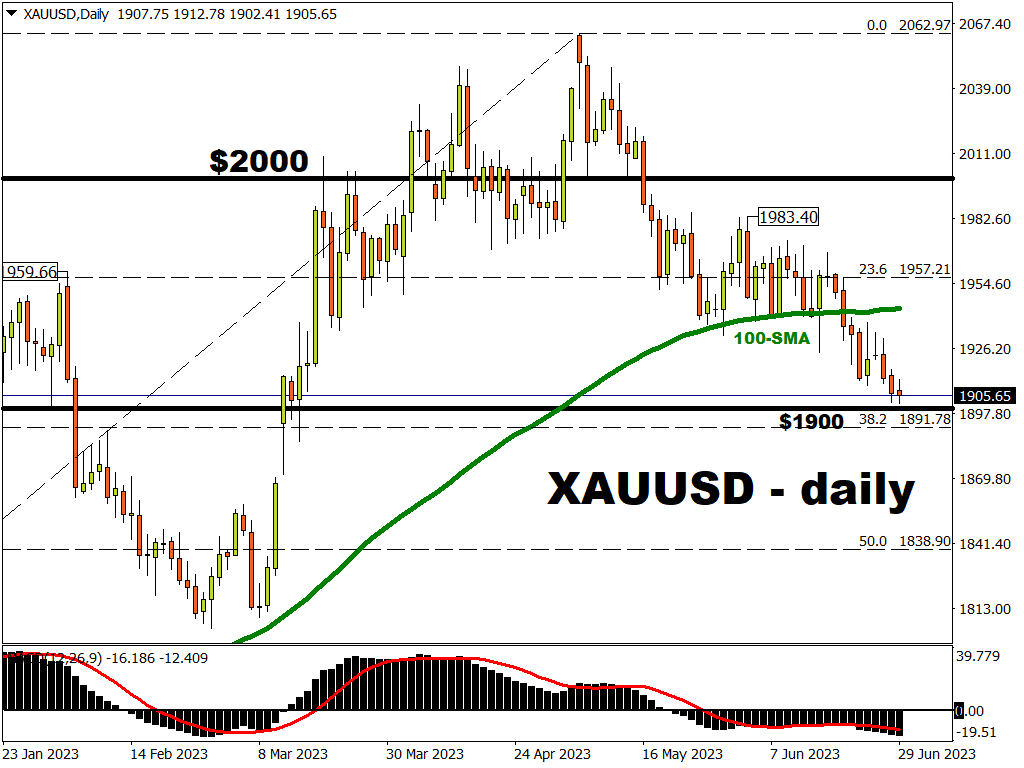
Why has gold fallen since May?
This is because markets have pushed back expectations for a Fed rate CUT.
- Back in early May, markets had expected the Fed to LOWER its benchmark rates by September 2023.
- However, US inflation has since proven stubborn and the Fed appears willing to trigger more rate hikes than previously expected.
- Today (June 29th), markets expect a 70% chance that the Fed will CUT rates only in May 2024!
Hence, given that investors are not paid to hold on to gold (a zero-yielding asset), markets have since dumped the precious metal in favour of other asset classes.
Though to be clear, despite recent declines ...
Gold remains the second best-performing traditional asset class so far this year.
(excluding cryptos such as Bitcoin which has soared by more than 85% over the same period).
- First place in 1H23 goes to global stocks (measured by MSCI ACWI Index) which climbed by 11.4%.
- Second-placed bullion has a year-to-date gain of about 4.4% at the time of writing.
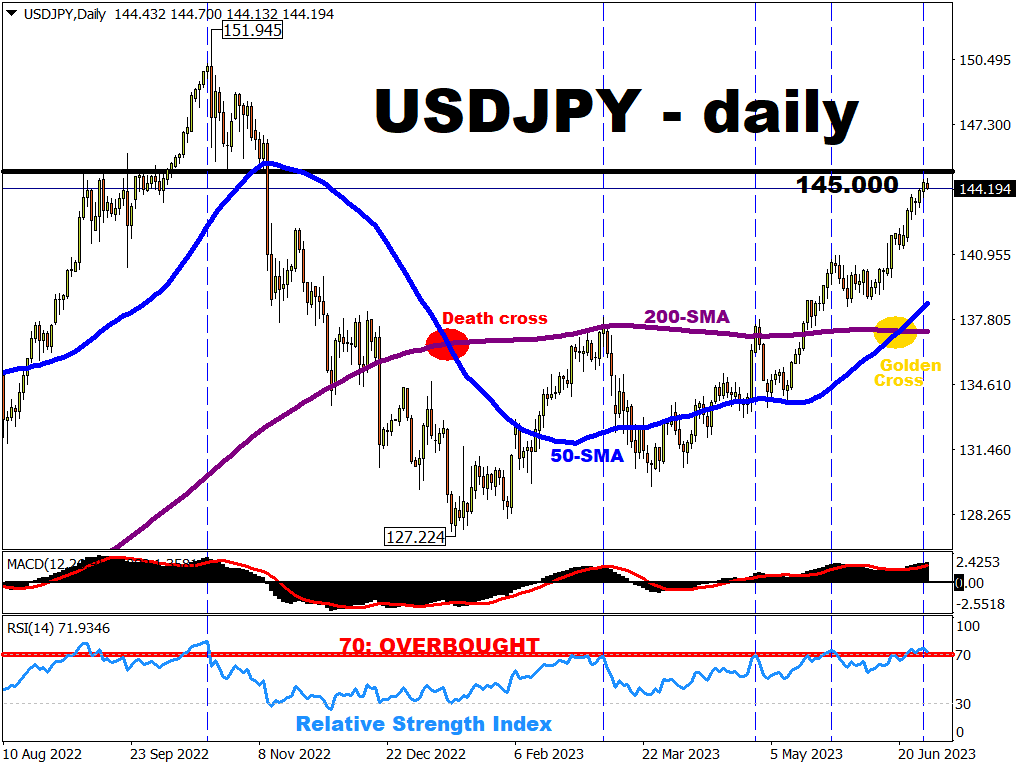
2) USDJPY back down to 125?
No, but it came close.
USDJPY initially appeared destined to claim the 125 target, reaching as low as 127.224 by mid-January.
Since then, USDJPY broke out of its downtrend to recently form a golden cross (when 50-day moving average crosses above 200-day moving average - a technical signal that often implies further gains ahead).
This major FX pair is now trading around its highest levels since November 2022.
What went wrong?
As stated in the USDJPY section of my January 4th article:
Still-dovish BoJ: the incoming BoJ Governor keeps Japan’s benchmark rate mired in negative territory on signs that inflation is not as sticky as hoped.
This scenario would be made worse if the Fed stays hawkish and keeps sending US interest rates much higher than the currently forecasted peak of around 5%.
The “wrong” scenario cited above has instead been the case so far this year.
The Bank of Japan (BoJ) apparently isn't yet budging from its negative interest rates regime, while the Fed now projects US rates to peak around 5.6%.
Hence, Yen bulls (those hoping the Yen will strengthen) have given up for now.
However, note that markets are still predicting a greater-than-even chance (55%) of a BoJ rate hike by Dec 2023.
Should those odds firm up, that may yet restore hope for a Yen recovery and a lower USDJPY eventually.
3) FTSE China A50 Index back above 14,000?
Yes. 14k line was breached on January 14th.
To be honest, when I saw that the psychologically-important 14,000 mark had been surpassed a mere 10 days after my January 4th article, I initially chided myself, thinking I should have been more bullish in my predictions.
Instead, this turned out to be a rather PRUDENT forecast.
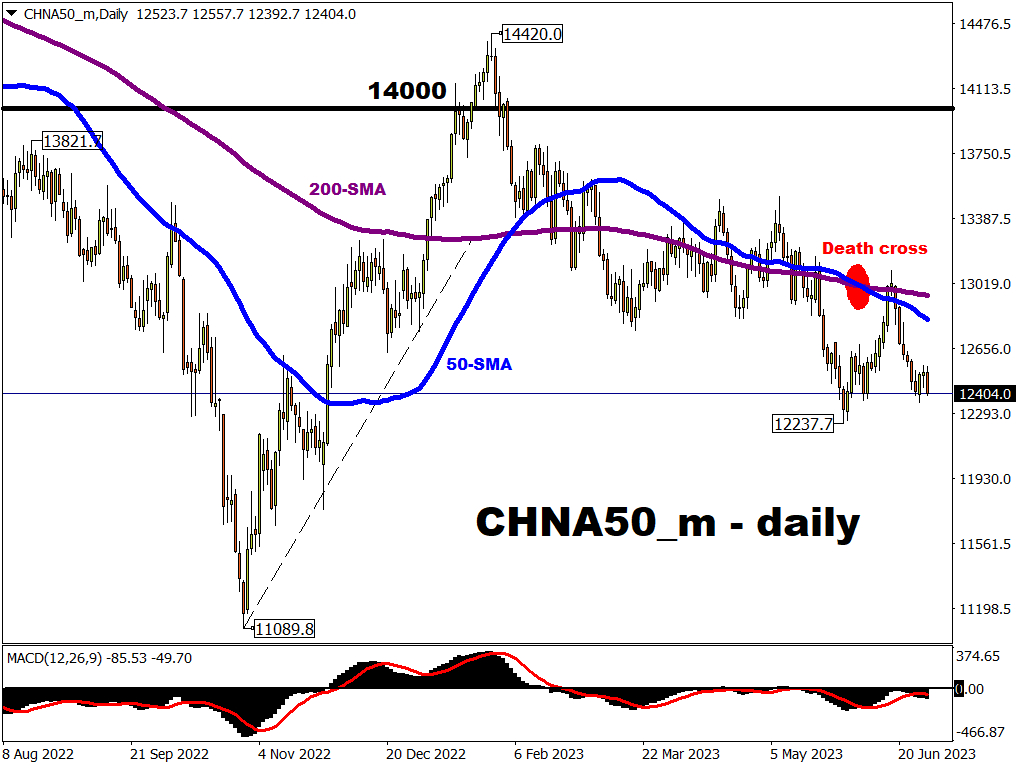
Since peaking at 14,420 in late January, which was a further 3% beyond the 14k mark, this stocks index (which tracks the 50 largest A-share Chinese companies) has embarked on a downtrend (a series of lower highs and lower lows).
In other words ...
The 14k mark was just about as good as it got for the CHNA50_m index so far in 2023.
This is because China’s much-hyped recovery has fizzled out.
The economic momentum has clearly struggled post lockdowns, to the point that the People’s Bank of China (PBOC – China’s central bank) has pivoted to a supportive policy stance.
The PBOC's support policy stance is in stark contrast to that at other major central banks (Fed, ECB, BOE, etc.) who are still busy hiking interest rates.
Until China’s economic recovery can find a more solid footing, Chinese assets ranging from its stock markets to the Yuan are set to find it difficult to stage a meaningful recovery.
Same goes for other assets that are reliant on the Chinese economy, including the likes of the Australian dollar (AUDUSD) as well as oil prices.
So there you have it.
Surely, it has been an eventful first half.
If the 2nd half of 2023 proves to be as eventful, that may herald more trading opportunities across global financial markets.
And we'll be keeping you up-to-date via our Daily Market Analysis.
And in case you missed it ...
Here are our top-5 most-read articles (out of the 128 articles, excluding this one) that have been published on the FXTM website so far this year:
- (MAY 1st) Trade of the Week: The return of $2k gold?
-
(APRIL 3rd) Trade Of The Week: More Volatility For AUDNZD After OPEC+ Shocker?
-
(JANUARY 3rd) 2023 Outlook: Is the worst behind us?
-
(MARCH 3rd) Week Ahead: Watch these 3 major FX pairs
NOTE:
- FXTM's "Trade of the Week" articles are published on the website and emailed every Monday (except holidays)
- FXTM's "Week Ahead" articles are published on the website and emailed to clients every Friday (except holidays)
Ready to trade with real money?
Open accountChoose your account
Start trading with a leading broker that gives you more.