
Daily Market Analysis and Forex News
Mid-Week Technical Outlook: Global indices

- SPX500_m waits for fresh catalyst
- NQ100_m breakout on horizon?
- UK100_m flirts around 200-day SMA
- STOX50_m approaches 4100 support
- GER40_m ready to resume decline?
An air of caution permeated global markets on Wednesday as investors closely monitored corporate earnings and the ongoing conflict in the Middle East.
The combination of geopolitical risk and Fed rate expectations has left investors on edge, weighing on equity markets while supporting appetite for safe-haven assets. In the currency space, sterling has appreciated against most G10 currencies this morning after UK inflation data exceeded forecasts. Oil continues to draw from the negative developments in the Middle East while gold has jumped to its highest level in four weeks amid risk aversion.
This has been an eventful week for markets thus far with volatility likely to pick up as focus falls on speeches from a host of Fed officials and corporate earnings. Our attention this afternoon will be directed toward the global equity arena with the trusted tool of choice none other than technical analysis.
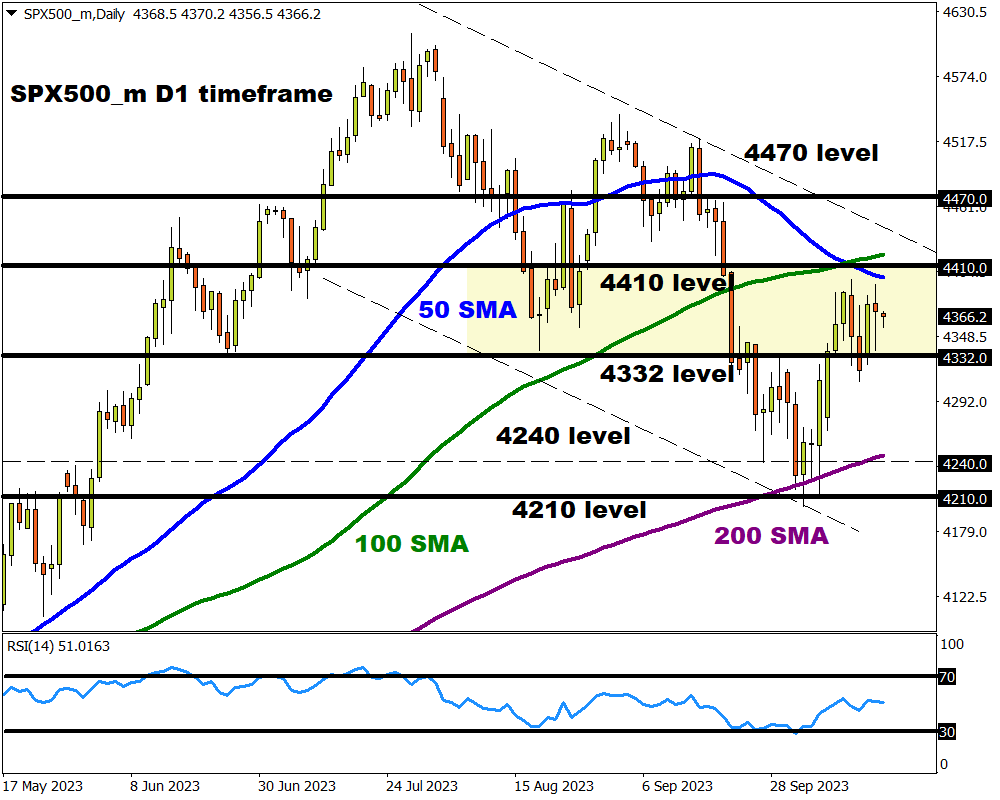
SPX500_m waits for fresh catalyst
The S&P 500 remains trapped within a range on the daily charts with support around 4332 and resistance at 4100 – a point between the 50 and 100-day SMA. Although prices are respecting a bearish channel, the index seems to be consolidating – waiting for a fresh fundamental spark.
- A strong daily close below 4332 may trigger a selloff towards 4240 where the 200-day SMA resides. Weakness below this point could invite a steeper decline towards key support at 4210.
- Should prices push back above 4410, bulls could be inspired to target 4470.
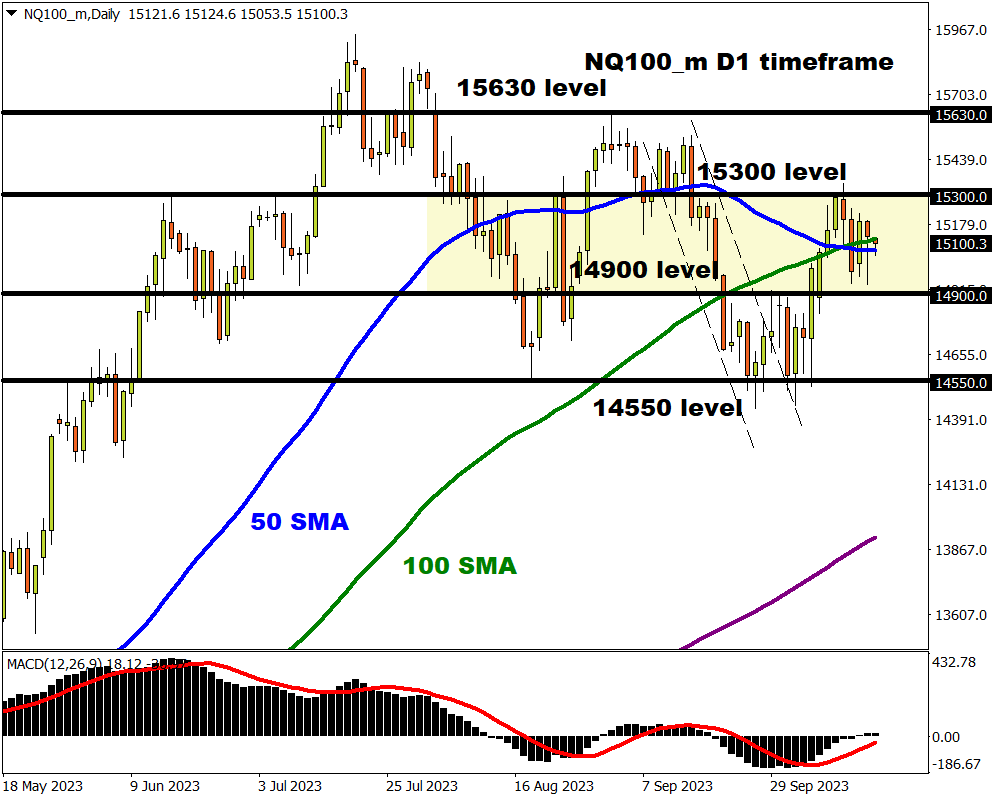
NQ100_m breakout on horizon?
As discussed in our “Trade of the week”, this could be a wild week for the NQ100_m thanks to Fed speeches and earnings from tech giants such as Tesla and Netflix. Prices remain trapped within a range with support at 14900 and resistance at 15300.
- A strong breakout above 15300 could inspire an incline towards 15630.
- If prices slip below 14900, bears may target 14550.
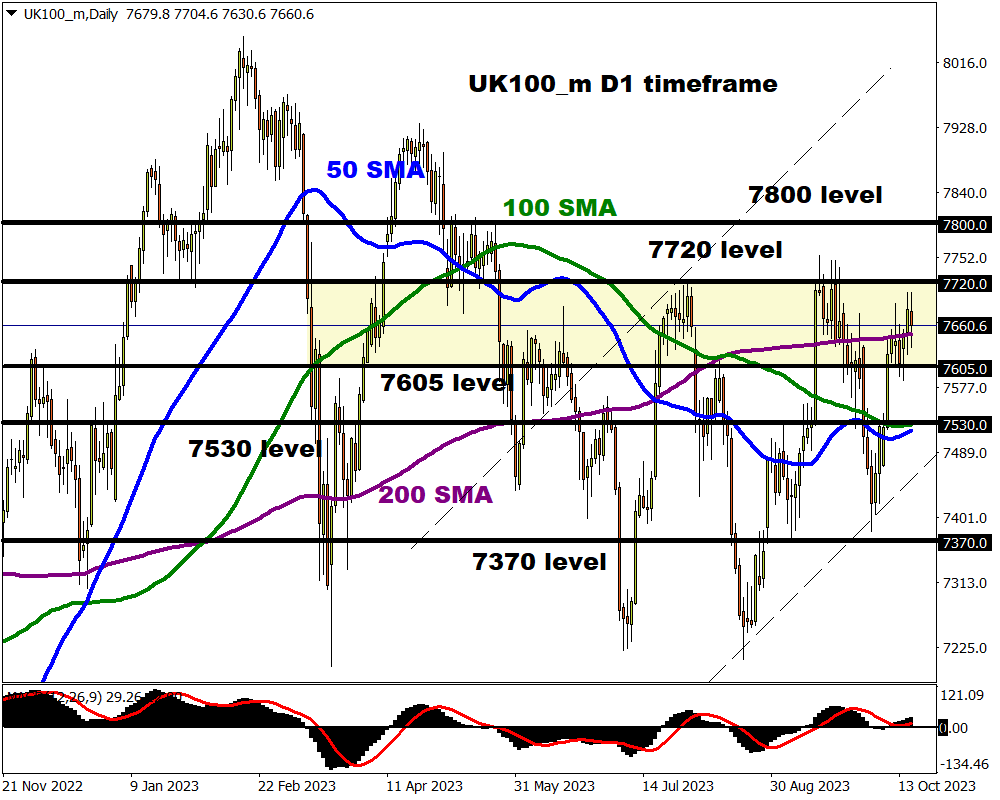
UK100_m flirts around 200-day SMA
The FTSE 100 remains a choppy affair on the daily charts as prices bounce within a range. A layer of resistance can be found at 7720 while support can be found at 7605. A break higher or lower could be a possibility but this depends on how prices react to the 200-day SMA.
- Should bulls push prices beyond 7720, this could encourage an incline towards 7800.
- A bearish break below 7605 could inspire a decline towards 7530 – where the 100-day SMA can be found.
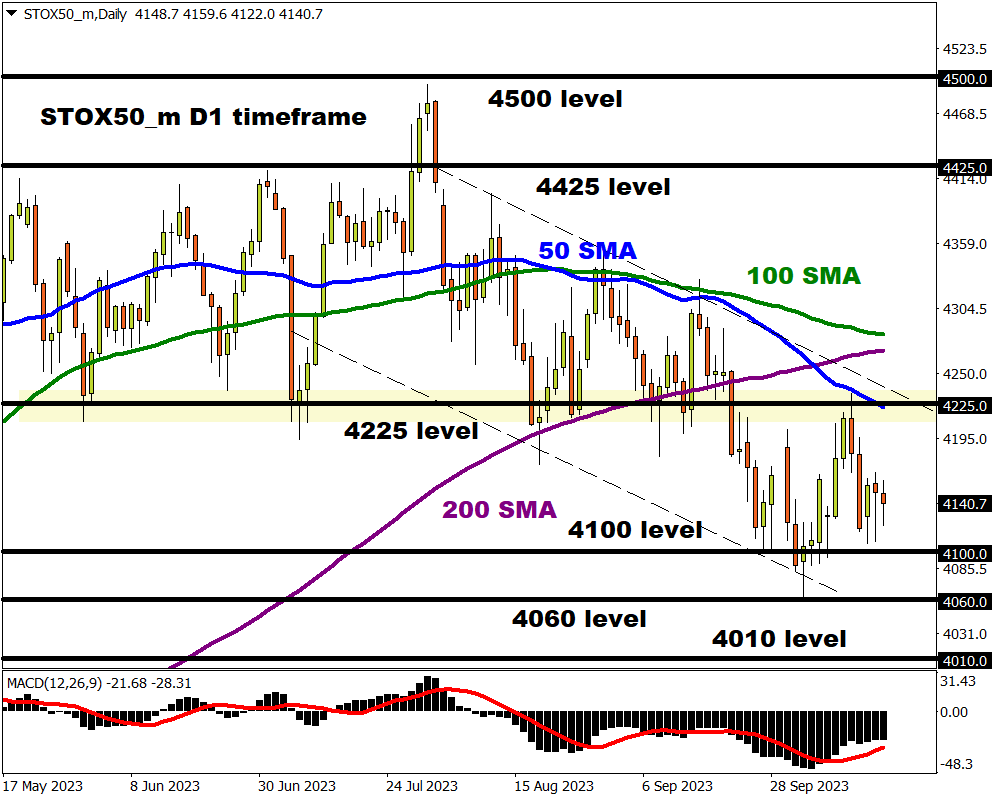
STOX50_m approaches 4100 support
After kissing the 50-day SMA last week, STOX50_m bears seem to be back in the driving seat with prices approaching support at 4100. The trend is bearish on the daily charts with prices trading below the 50, 100, and 200-day SMA. There have been consistently lower lows and lower highs while the MACD trades below zero.
- A solid daily close below 4100 could see price tests 4060 and 4010.
- If 4100 proves to be reliable support, a rebound back towards 4225 could be on the cards.
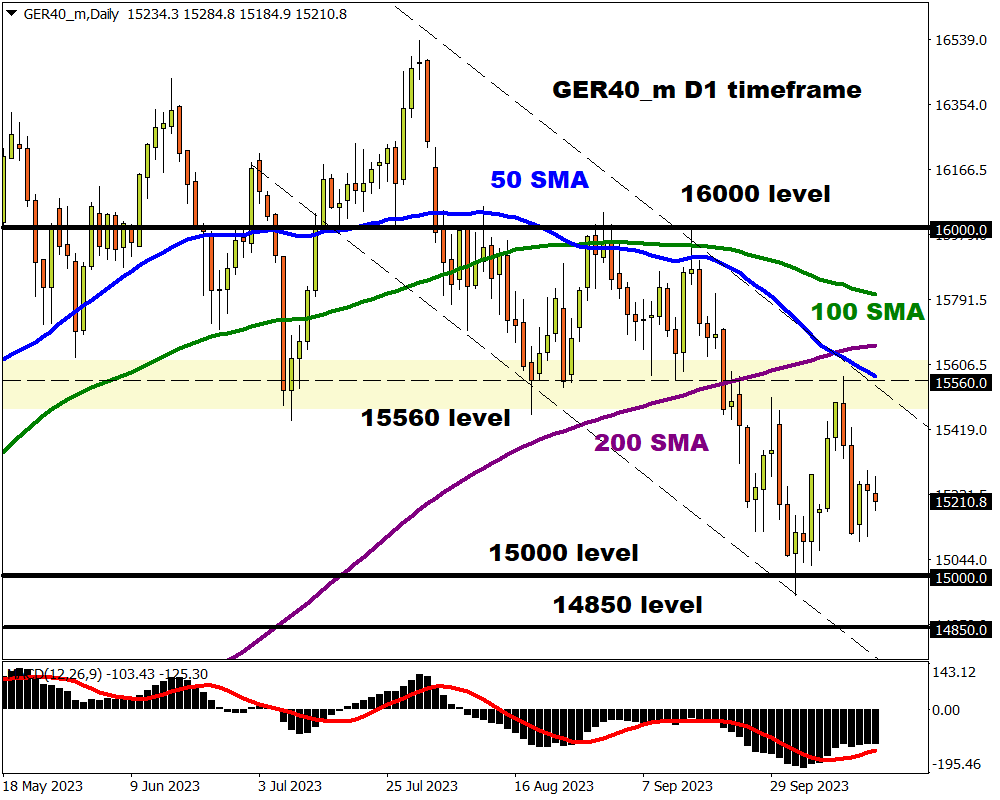
GER40_m ready to resume decline?
The GER40_m Index remains under pressure on the daily charts. There have been consistently lower lows and lower highs while prices are trading below the 50, 100, and 200-day SMA.
- Bears remain in a position of power with a strong daily close below 15000 carving a path towards 14850.
- If 15000 proves to be a tough nut to crack, a rebound back toward the 15560 level could be a possibility before bears jump back into the game.
Ready to trade with real money?
Open accountChoose your account
Start trading with a leading broker that gives you more.