
Daily Market Analysis and Forex News
Mid-Week Technical Outlook: Major World Indices

Caution was the name of the game on Wednesday as more disappointing Chinese economic data left investors on edge.
Market players seem to be on the defense with renewed fears of a hawkish Fed sapping risk appetite. In the currency space, Sterling jumped after UK inflation remained higher than expected last month. Although consumer prices fell sharply to 6.8% in July, down from 7.9% in June, it was still above the 6.7% forecast. Looking at commodities, oil slipped for a third day while gold prices hovered around $1900.
Much attention will be directed towards the FOMC meeting minutes this evening which could offer key clues on the central bank’s next policy move. In the meantime, our focus falls on the global equity space with the tool of choice none other than technical analysis.
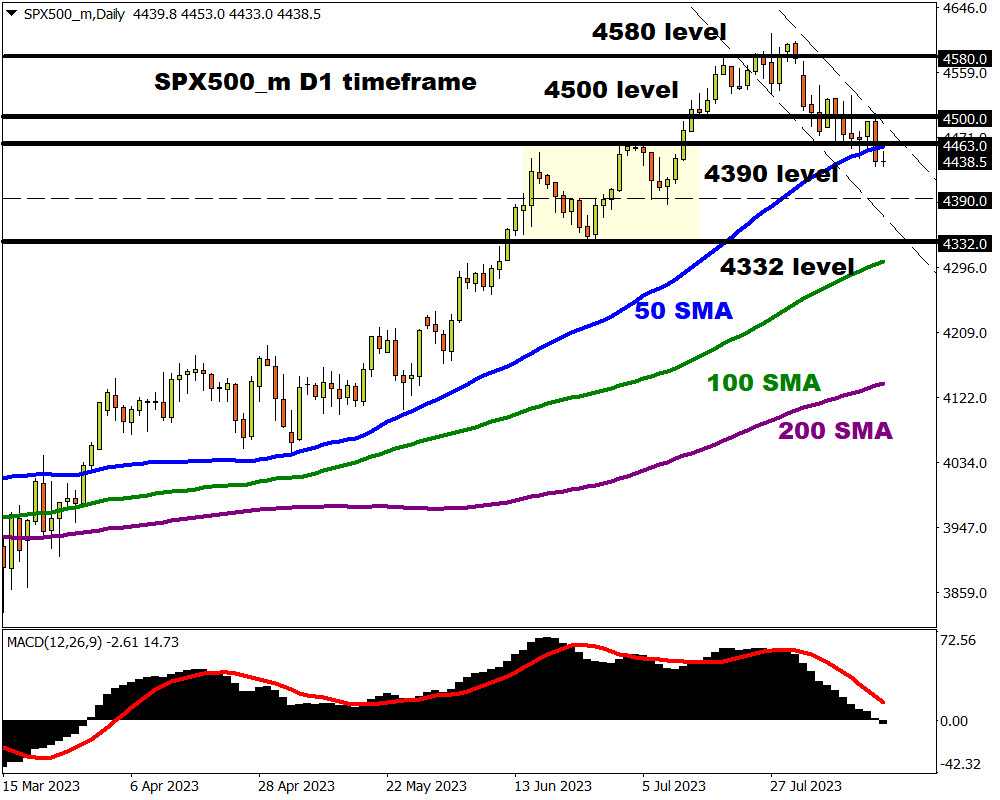
SPX500_m to extend losses?
The S&P 500 experienced a sharp selloff yesterday, closing below its 50-day SMA for the first time since March. This development could signal further downside with the next key levels of interest at 4390 and 4332, respectively. Should prices push back above 4500, bulls may target 4580.
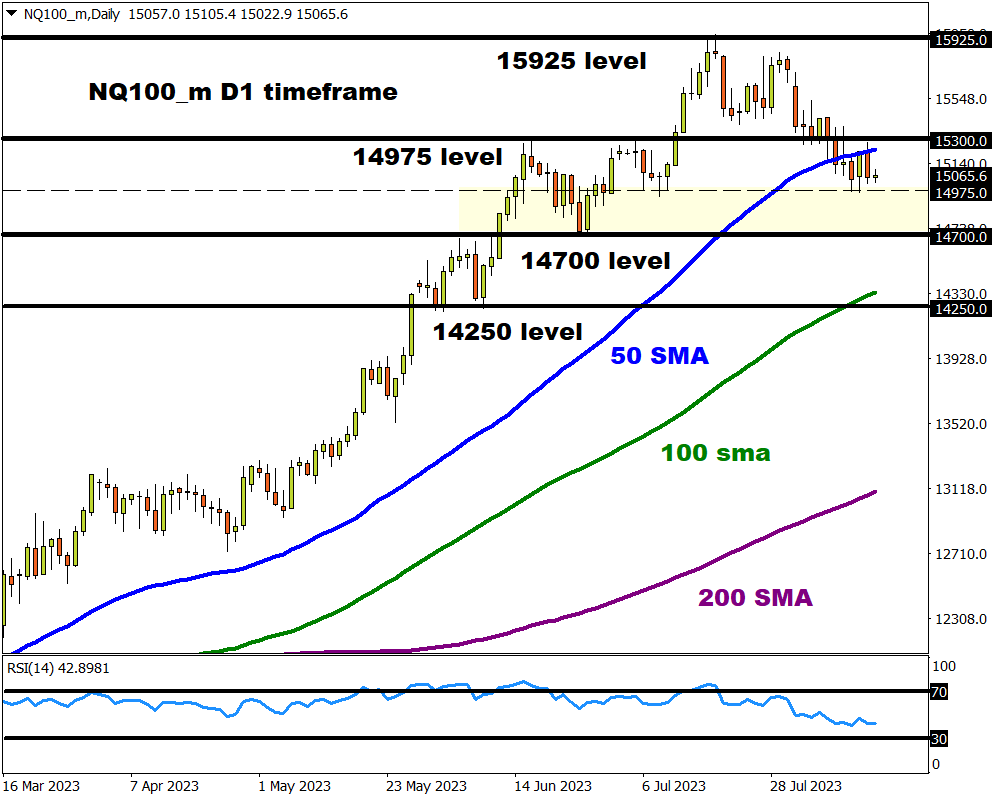
NQ100_m breakout pending?
After breaking below the 50-day SMA, the Nasdaq 100 has traded within a narrow range with support at 14975 and resistance at 15300. A breakout below the current support could open a path toward 14250, just below the 100-day SMA. Should prices push back above 15300, bulls may eye 15925.
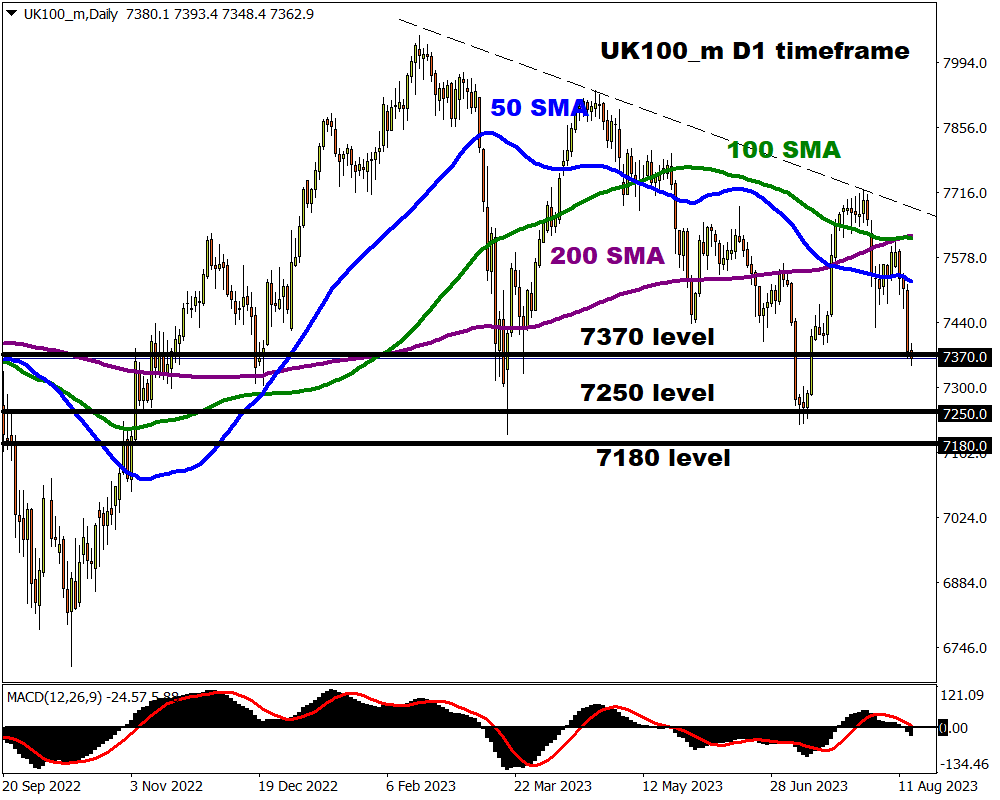
UK100_m eyes key support
UK100 bears remain in the driving seat on the daily charts with prices approaching key support at 7250. A breakdown below this level may encourage a decline towards 7180 and potentially lower. Should 7250 prove to be reliable support, prices may rebound back towards the 50-day SMA.
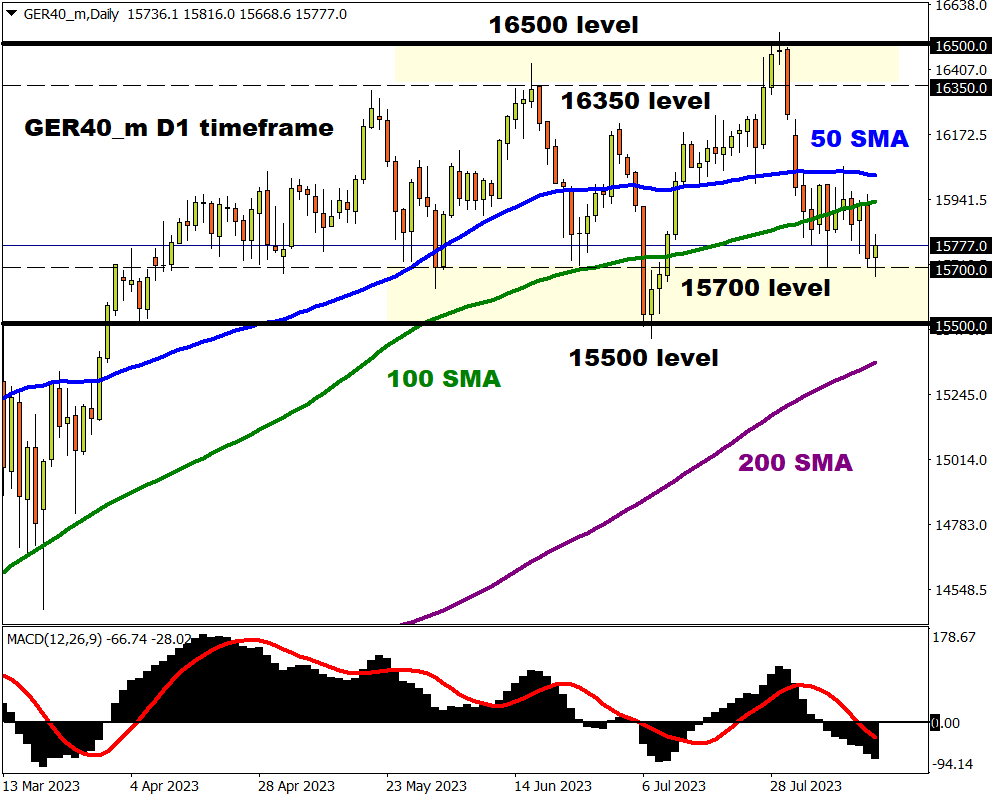
GER40_m trapped within wide range
The GER40 Index has been trapped within a range since April 2023 with major support at 15500 and resistance at 16500. Prices are trading below the 50 and 100-day SMA while the MACD trades to the downside. A break below 15700 may see prices test 15500. If bulls can take prices back above the 50-day SMA, the next key level of interest can be found at 16350.
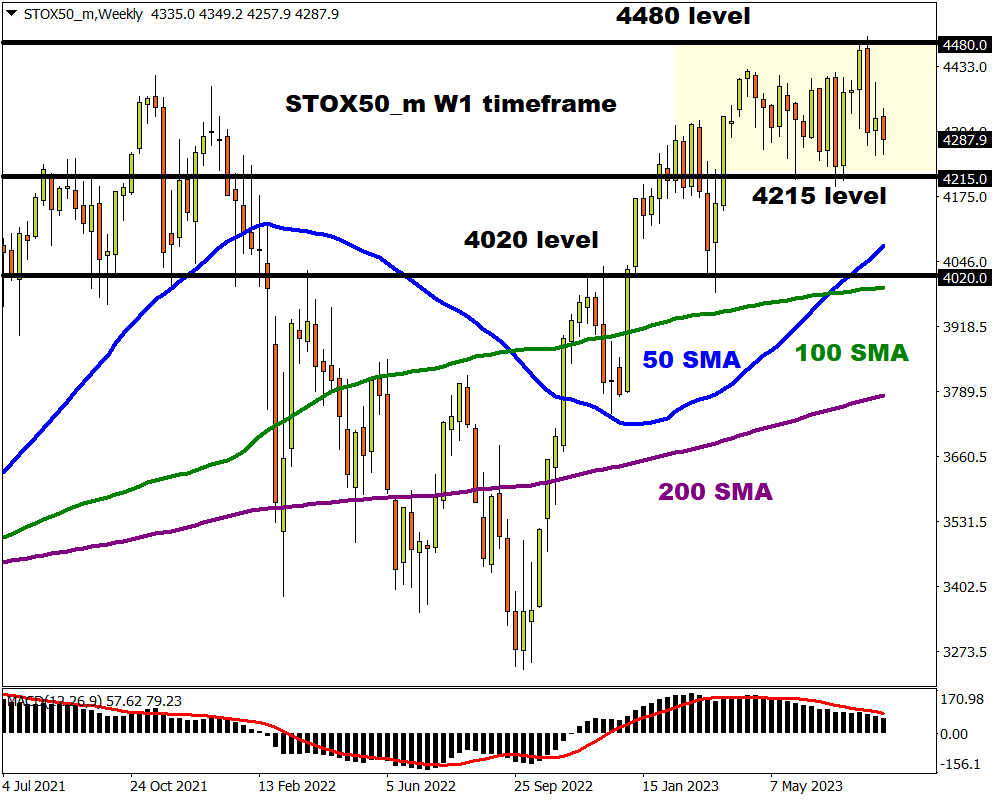
STOX50_m choppy affair
As the subtitle says, the STOX50_m remains a choppy affair on the weekly charts. Support can be found at 4215 and resistance at 4480. A decline below 4215 may see bears target 4020, a level just above the 100-week SMA.
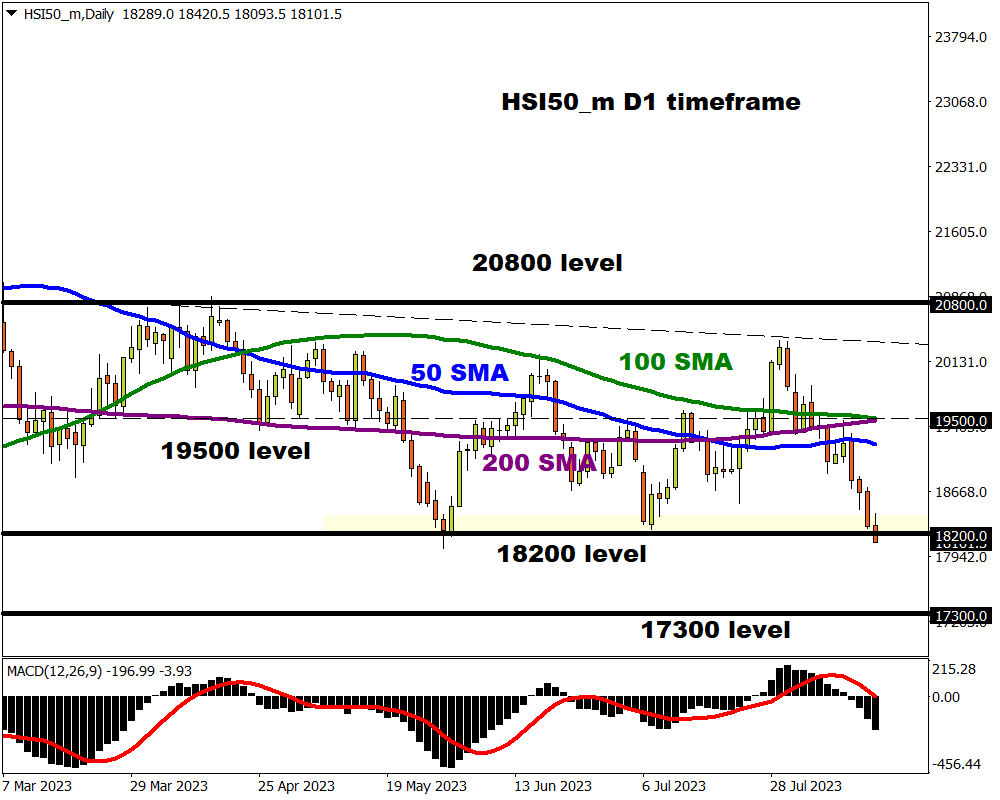
HSI50_m under pressure
The recent breakdown on the HSI50_m could signal further downside in the short to medium term. Should bears secure a solid close below 18200, this could open a path toward 17300. If prices experience a rebound from 18200, the next key level of interest can be found at 19500 – where the 100 and 200-day SMA reside.
Ready to trade with real money?
Open accountChoose your account
Start trading with a leading broker that gives you more.