
Daily Market Analysis and Forex News
NatGas bullish opportunity on horizon

- NatGas busy with correction wave in uptrend
- Weekly support may trigger long opportunity
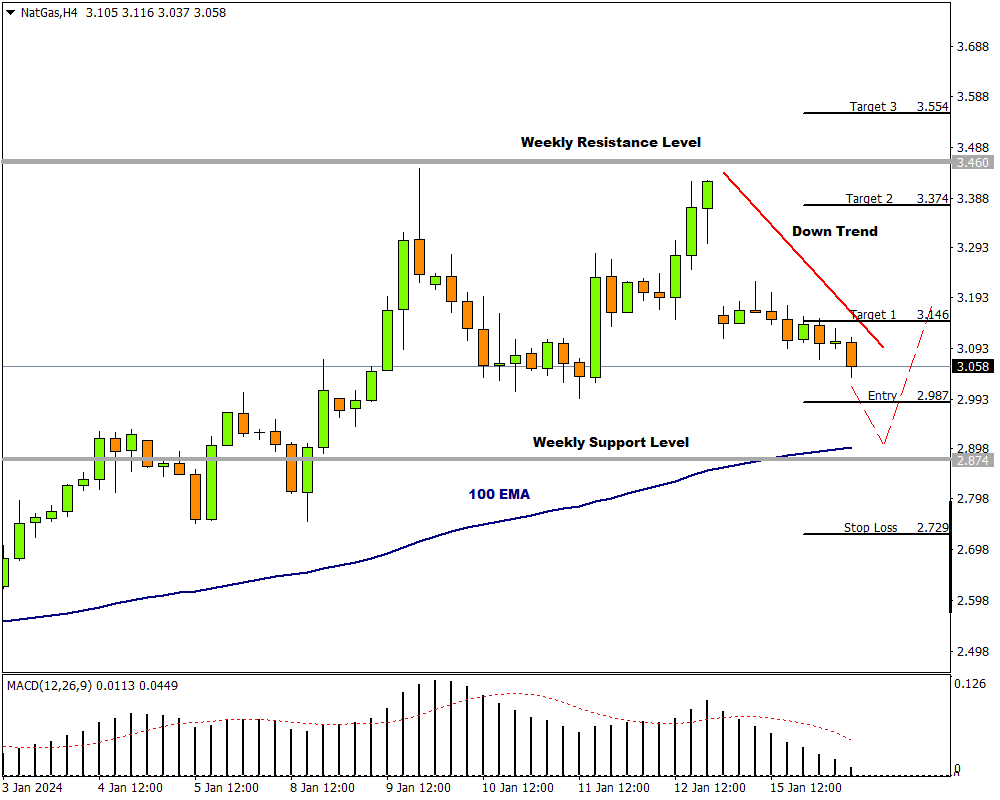
- Prices trading above 100 EMA on H4 chart
- 3 potential bullish targets identified
- Bullish scenario invalidated below 2.729
US natural gas prices have been at the receiving end of sustained bullish momentum for some time now.
The commodity jumped last Friday as cold weather across the United States boosted the demand outlook for heating.
After a final push last week, a fresh resistance level was reached but not breached. At the resistance level a correction wave started, and this might have enough momentum to reach a previous weekly support level. If the level is reached and holds, a long opportunity might ensue.
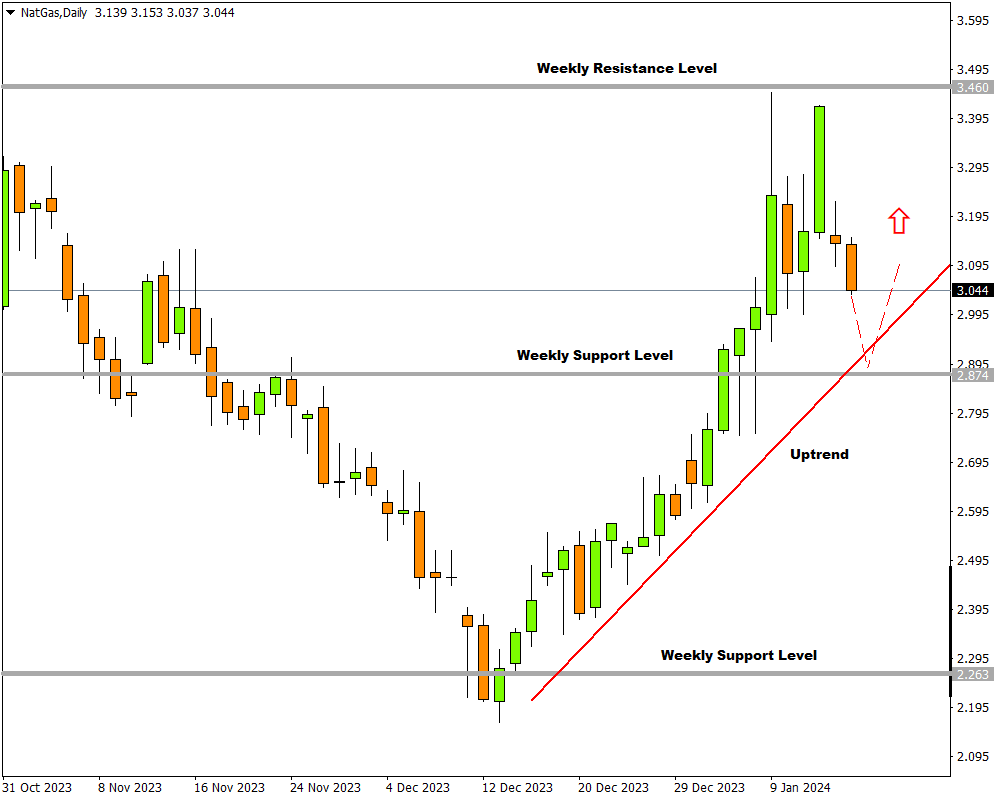
A look at the 4-hour time frame will produce more understanding.
The 4-hour chart is busy with a down trend as the daily trend correction wave plays out. The 4-hour 100 Exponential Moving Average (EMA) as well as the Moving Average Convergence Divergence (MACD) are still in bullish mode and the 100 EMA confirms the possible support level around 2.874 as indicated by the weekly support level.
If the price reaches the 2.874 level then a long opportunity becomes possible.
Attaching a modified Fibonacci tool to the trigger level at 2.987 and dragging it to the below daily support level at 2.729, three possible targets can be established:
-
The first target is possible at 3.146 (Target 1).
-
The second price target is likely at 3.374 (Target 2).
-
The third and last price target is feasible at 3.554 (Target 4) if buyers are able to press through the next weekly resistance level at 3.460.
If the price at 2.729 is broken, this scenario is no longer applicable.
Ready to trade with real money?
Open accountChoose your account
Start trading with a leading broker that gives you more.