
Daily Market Analysis and Forex News
SPX500 bears try to gain momentum

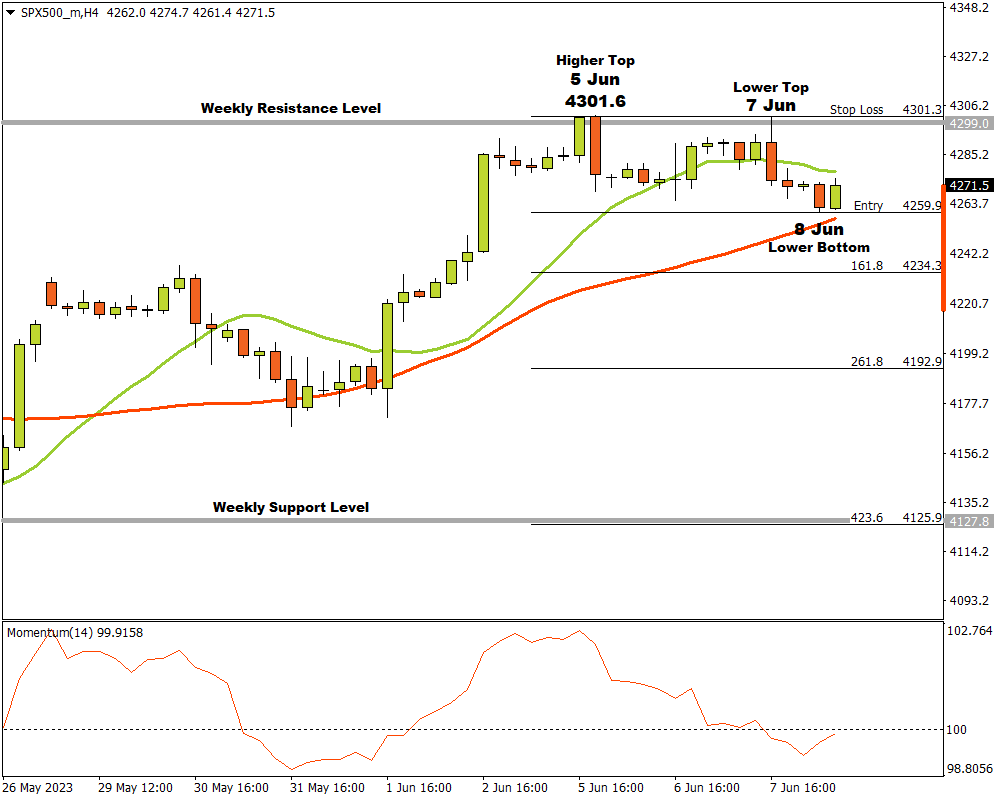
The SPX500_m index seems to be in a sturdy uptrend on the H4 timeframe with prices making a higher top at 4301.6 on Monday 5th June.
However, bears could be making an appearance after prices hit the weekly resistance level as sellers start coming into the market in more numbers. After hitting 4301.6, prices broke through the 15 Simple Moving Average (SMA) and the Momentum Oscillator altered course to the lower side, both confirming the intensified bearish action in the market.
After some initial bearish action and then a bit of flat lining, bulls re-tested the weekly resistance level but were not successful with a lower top forming on 7 June at 4301.3. Bears then gathered in more numbers with a possible critical support level forming when a lower bottom was recorded at 4259.9 on 8 June.
If the bears manage to break through the critical support level at 4259.9, then three possible price targets can be projected from there. Attaching the Fibonacci tool to the lower bottom at 4259.9, and dragging it to the lower top at 4301.3, the following targets may be calculated.
- The first target can be estimated at 4234.3 (161.8%).
- The second price target may be calculated at 4192.9 (261.8%).
- If the price has enough momentum to reach the next weekly support level, the third and final target may be expected at 4125.9 (423.6%).
- Alternatively, should the resistance level at 4301.3 is broken, the above scenario is cancelled and must be re-assessed.
As long as the bears keep building momentum, the outlook for SPX500_m on the H4 time frame will remain to the downside.
Ready to trade with real money?
Open accountChoose your account
Start trading with a leading broker that gives you more.