
Daily Market Analysis and Forex News
US CPI to restore NQ100_m closer to 16,000?

Astute traders would have noticed some interesting price action on the NQ100_m of late.
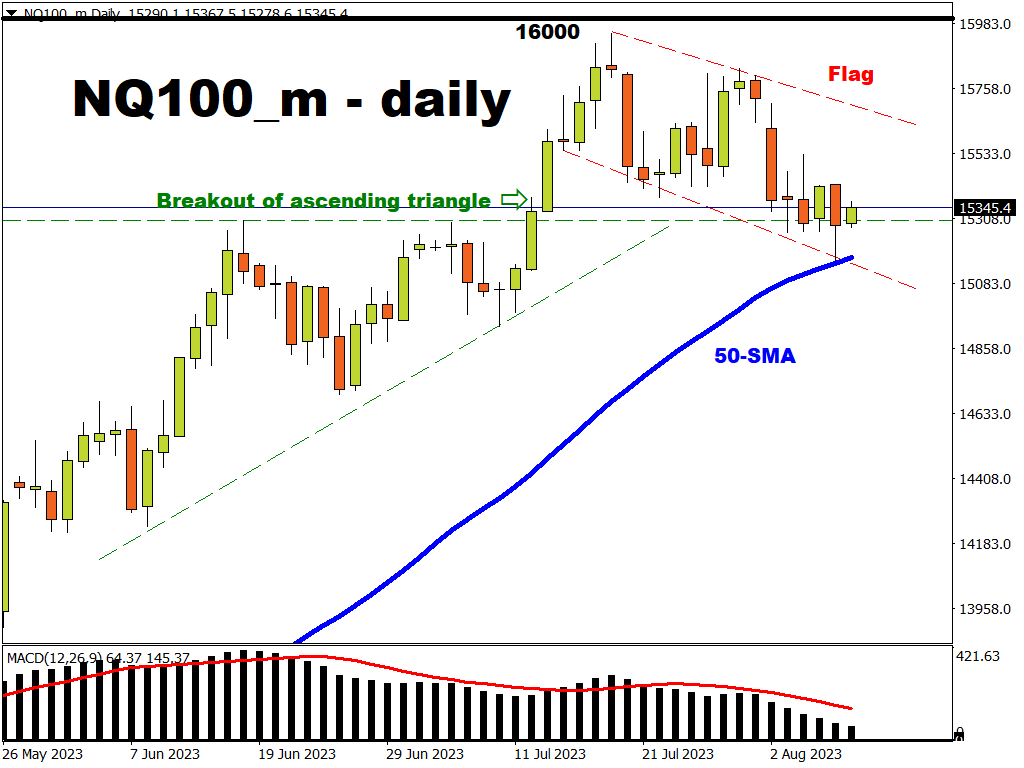
After breaking out of an ascending triangle which was in formed from 9th June to 11th July ( 23 trading days), current price action sees NQ100_m bouncing off the support area of a bullish flag.
A flag is a short channel that usually slopes in the opposite direction of a trend, and is usually a continuation pattern.
This support area coincides with the former ascending triangle resistance, which is now support.
Worthy of note is the fact that this support area (former ascending triangle resistance) has held the fort since the 3rd of August.
Interestingly, yesterday’s price action also saw the 50-day SMA on the daily chart act as a dynamic support with a rejection of price at the 15151.3 low to close within the flag pattern.
From a fundamental perspective ...
Tomorrow’s (Thursday, August 10th) US inflation report could be a major catalyst for NQ100_m’s next big move!
Inflation is typically measured by the consumer price index (CPI), which measures the change over time in the prices paid by consumers for a basket of goods and services.
The upcoming print is expected to show that both headline and core CPI rose by 0.2% in July 2023 compared to June 2023 (month-on-month). This would match June’s 0.2% month-on-month readings as well.
However, for the year-on-year figures (July 2023 vs. July 2022), this is where the action may stem from.
The headline CPI is expected to tick back higher to 3.3%, versus June’s 3% year-on-year number.
Meanwhile, the core CPI (which excludes more volatile food and energy prices) is expected to moderate slightly down to 4.7% from June’s 4.8%.
Looking further out to Friday, August 11th, the measures of consumer inflation expectations over the next 1-10 years could also influence markets.
Ultimately, if these CPI prints come in well below market expectations, this should signal that the Fed’s rate hikes are having the desired effect, and should further dampen any notion of additional rate hikes for the remainder of the year.
The narrative above should see NQ100_m’s prices rally to test and possibly break the flag resistance. (see above chart)
If the flag’s resistance is breached, the measured move objective would be the distance of the flagpole which is more than 10,000 points (measuring from 10th Julys low of 14933.8 to 19th, Julys high of 15947.7)
A strong upside breakout may even push this tech-heavy index back closer to the psychologically-important 16,000 mark.
On the other hand, bears are set to look out for a set of stronger-than-expected CPI prints for the NQ100_m to test and possibly break the flag's support.
This would mean the past ascending triangles resistance, which is now acting as support at 15270, would have to give way first.
After that, bears will be targeting the crucial support lines seen at its 50-day SMA as well as the lower bound of this current “flag”.
Ready to trade with real money?
Open accountChoose your account
Start trading with a leading broker that gives you more.