
Daily Market Analysis and Forex News
USDInd: Can dollar bulls sustain momentum?
- USDInd textbook uptrend approaches weekly resistance
- 4 potential targets, if uptrend persists
- Warning: Bearish divergence spotted
- Bullish scenario is invalid if prices go below 105.672
- Upcoming US jobs data may dictate USDInd’s next moves
The bulls in the USD Index on the D1 chart have been riding high.
The underlying US dollar index has climbed by 3.2% so far in 2023, with this textbook uptrend evident since mid-July as it posted consecutive higher tops and higher bottoms.
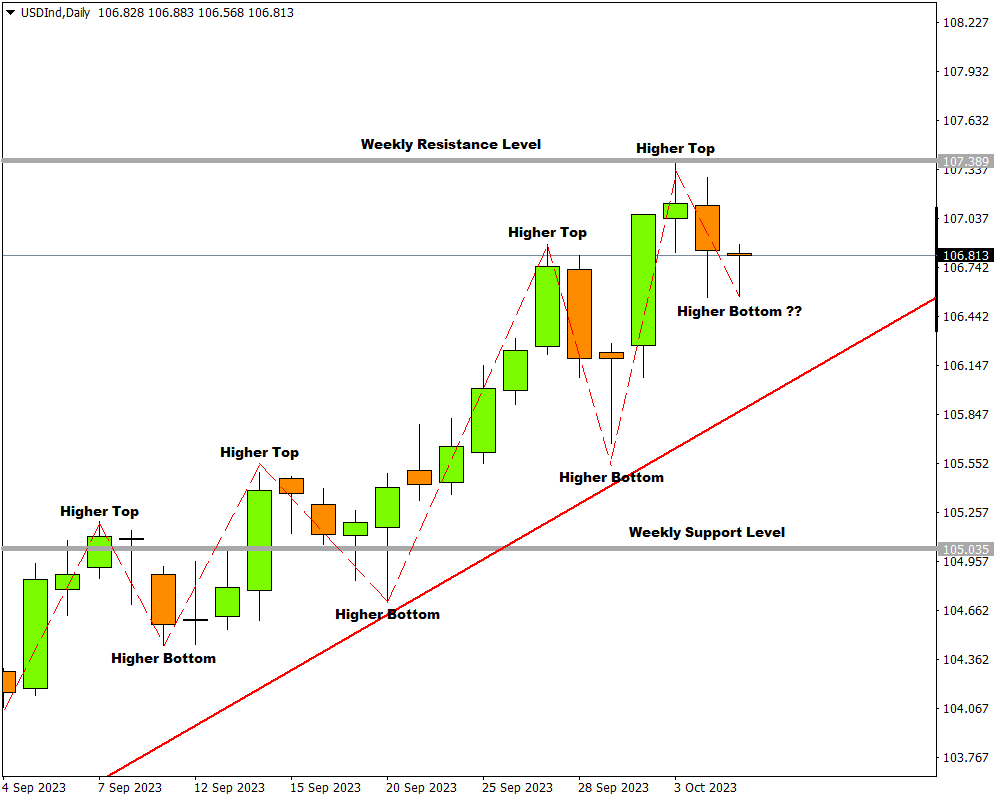
Although the bears are currently busy with a correction wave within that uptrend, the bulls seem to be gathering in numbers already.
Will they be able to sustain their momentum and start a new impulse wave?
Let us use the fractal nature of the market structure and look at the H4 chart to see what the market is saying.
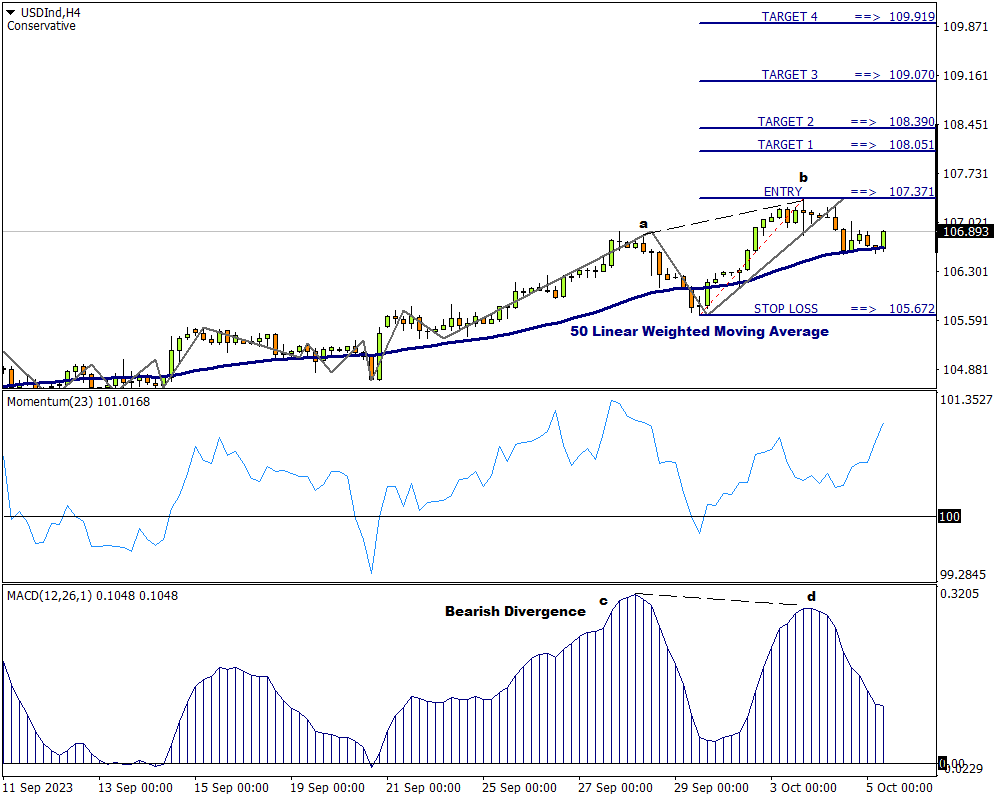
The H4 chart reveals more details, with the most glaring being the bearish divergence between USDInd’s price chart and the MACD (Moving Average Convergence Divergence) Oscillator.
- Looking at prices, note the higher top at ”a” followed by another higher top at “b”.
- Meanwhile on the MACD, note that the ‘d’ top is lower than the top at “c”.
This suggests that a warning light might be flashing.
However, with the price being above the 50 Linear Weighted Moving Average, along with Momentum as well as the MACD Oscillator that are still in bullish territory, the uptrend may well prevail on the H4 timeframe.
Attaching a modified Fibonacci tool to a trigger level at 107.371 and dragging it to a stop loss just below a last proper swing at 105.672, four possible targets can be established:
- Potential Target 1: 108.051
- Potential Target 2: 108.390
- Potential Target 3: 109.070
- Potential Target 4: 109.919
However, take note, if the price at 105.672 is broken, this upward-looking scenario is no longer relevant.
From a fundamental perspective ...
The incoming US jobs data could also influence this US Dollar index's price movements going into the weekend:
- Thursday, October 5th:
US weekly initial jobless claims (forecast: 210k; higher than prior week's 204k)
- Friday, October 6th:
US September nonfarm payrolls report (forecast: 170k; lower than August's 187k)
US September unemployment rate (forecast: 3.7%; lower than August's 3.8%)
US September average hourly earnings (forecast: rose 0.3% between August till September; higher than August's 0.2% month-on-month)
Potential Scenarios
- The USDInd may resume its uptrend if shown stronger-than-expected US jobs data, that allows the Fed to trigger another rate hike by end-2023 and keep benchmark US rates higher for longer.
- However, the USDInd may pare recent gains if shown weaker-than-expected US jobs data, that prevents the Fed from another rate hike by end-2023 while perhaps paving the way for an eventual rate cut in the second half of 2024.
Ready to trade with real money?
Open accountChoose your account
Start trading with a leading broker that gives you more.