
Daily Market Analysis and Forex News
USDInd slips below weekly support
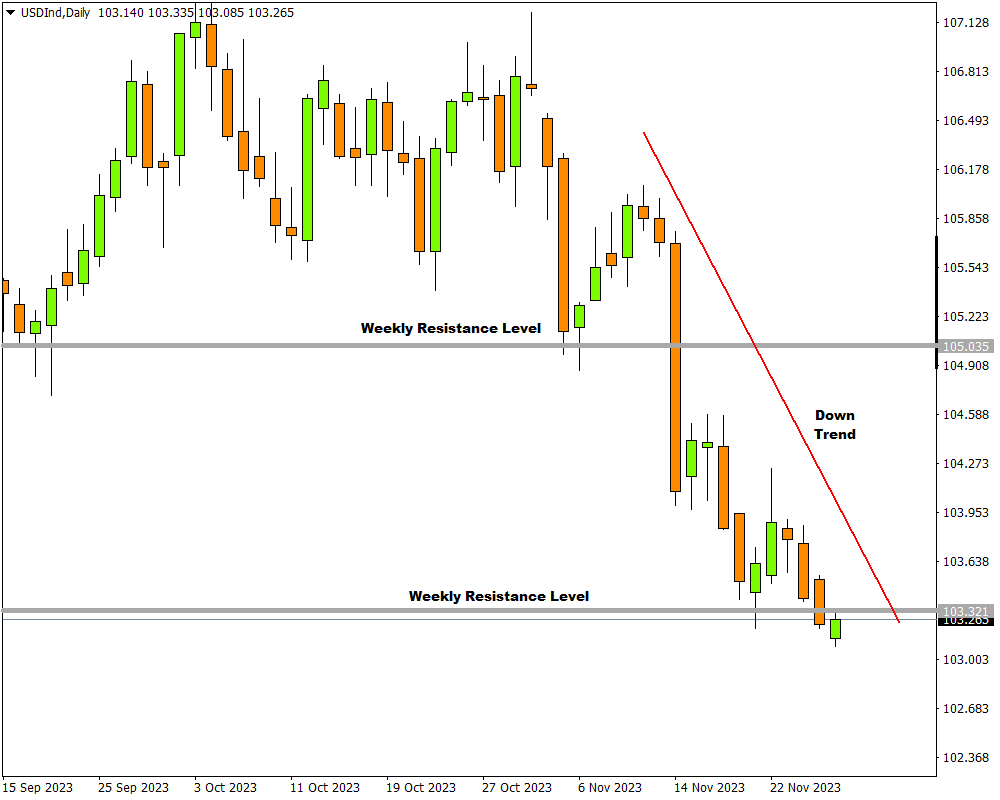
- USD Index busy with a D1 downtrend
- Broken weekly support may turn to resistance level
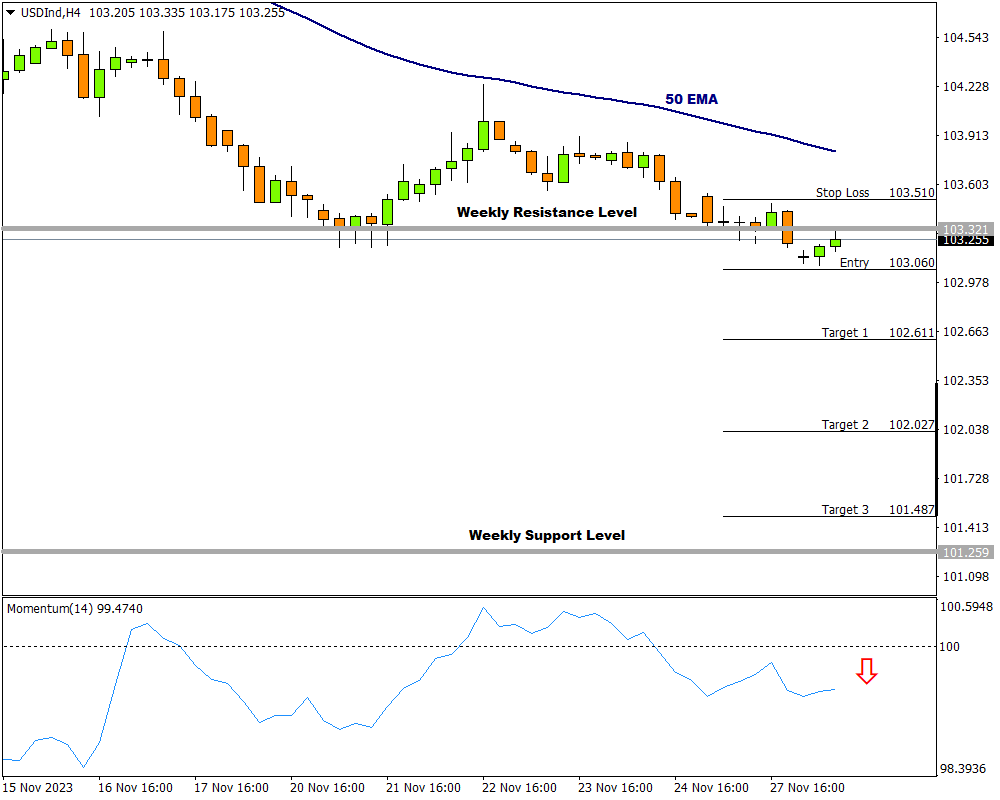
- H4 bearish scenario triggered if 103.060 price level breached
- Three potential targets identified on the H4 chart.
- Bearish scenario invalidated if prices push back above 103.510
Dollar bears could be enticed to drag prices lower after the USD Index slipped below a weekly support level.
This development may signal the resumption of the downtrend, especially if the new weekly resistance level strengthens the bearish resolve - causing the negative momentum to build as a result.
The H4 chart confirms the overall bearish dominance with the Momentum Oscillator below the 100 baseline in negative terrain and the price being lower than the 50 Exponential Moving Average.
If the weekly resistance level holds and the price reaches the 103.060 level, a short opportunity will be triggered.
Attaching a modified Fibonacci tool to a trigger level just below the last lower bottom at 103.060 and dragging it to just above the last lower top, three possible targets can be established:
The first potential target is at 102.611 (Target 1). This target will help with risk management.
The second price target is likely at 102.027 (Target 2).
The third and last price target is possible at 101.487 (Target 3), just before the next weekly support level.
If the price at 103.510 is broken, this scenario is no longer appropriate.
Ready to trade with real money?
Open accountChoose your account
Start trading with a leading broker that gives you more.