
Daily Market Analysis and Forex News
Week Ahead: SPX500_m poised for a ‘Santa Rally’?

- S&P 500 gains 8.9% in November
- December historically good month for stocks
- Keep eye on US jobs report and ‘Santa Rally’ chatter
- Prices trending higher but RSI signals overbought
- Can SPX500_m bulls maintain hunger for gains?
Christmas may have come early for investors after the S&P 500 ended November 8.9% higher!
This was not only its biggest monthly gain since July 2022 but also its fourth-best month in 10 years.
As we enter December, the stock index could see heightened volatility thanks to key US economic data and growing chatter about a ‘Santa Claus Rally’.
Monday, 4th December
- USD: US factory orders, durable goods
Tuesday, 5th December
- CNH: China Caixin services PMI
- AUD: Reserve Bank of Australia rate decision
- EUR: Eurozone S&P Global Services PMI, PPI
- JPY: Japan Tokyo CPI
- USD: US ISM Services, Job openings
Wednesday, 6th December
- AUD: Australia GDP
- CAD: Bank of Canada rate decision
- EUR: Eurozone retail sales, Germany factory orders
- GBP: Bank of England biannual stability report
- USD: US trade
Thursday, 7th December
- CNH: China trade, forex reserves
- AUD: Australia trade balance
- EUR: Eurozone GDP, Germany industrial production
- USD: US initial jobless claims
Friday, 8th December
- JPY: Japan household spending, GDP
- EUR: Germany CPI
- USD: US jobs report, University of Michigan consumer sentiment
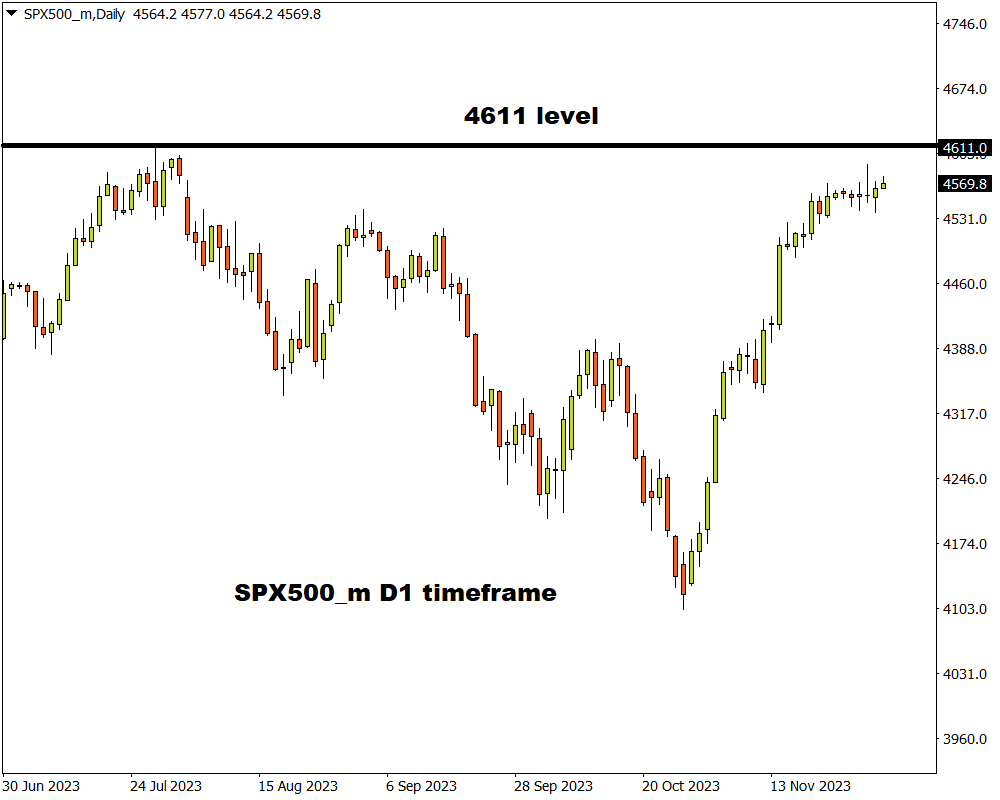
US equity bulls remain supported by cooling inflation, positive US economic data, and growing speculation around the Fed cutting interest rates in 2024. This is reflected in the SPX500_m which has created consistently higher highs and higher lows on the daily timeframe.
Note: SPX500_m tracks the S&P 500 index (the benchmark used to measure the stock performance of the 500 largest listed US companies)
With exactly one month left until the end of 2023, the question is whether SPX500_m bulls can maintain their hunger for gains.
Here are 3 factors to keep an eye on in the week ahead:
-
‘Santa Rally’ chatter
With Christmas just around the corner, discussion around a potential ‘Santa Clause Rally’ is likely to be widely discussed across the board.
This financial phenomenon is where stocks generally rise in the last week of December and the first two trading days of the new year.
It is not fully clear whether it’s purely psychological or triggered by some underlying financial forces, but history has shown that this is a recurring seasonal pattern.
Indeed, December has been a historically positive month for the S&P500 which has produced positive returns 75% of the time since 1994.
Markets seem to be in good spirits with chatter about a ‘Santa Rally’ possibly influencing the index over the next few weeks.
-
US November jobs report
On the data front, the US non-farm payrolls could offer fresh clues about what action the Federal Reserve will take beyond 2023.
The US economy is expected to have created 200,000 jobs in November, a noticeable pickup from the 150,000 jobs in October. The unemployment rate is forecast to remain unchanged at 3.9% while average hourly earnings are expected to tick lower to 4.0% year-on-year.
Given how tech stocks account for roughly 29% of the S&P 500 weighting, the incoming jobs report could spark volatility.
Note: Tech stocks are influenced by interest rates because their value is based on earnings forecasted in the future.
Traders are currently pricing in a 60% probability of a 25-basis point cut by March 2024, with a cut by May 2024 fully priced, according to Fed Funds futures.
- The SPX500_m is likely to trade lower if the US jobs report meets or exceeds forecasts and investors re-evaluate when the Fed will cut rates in 2024.
- Should the US jobs report market expectations, this could reinforce bets around the Fed cutting rates – supporting the SPX500_m as a result.
-
Technical forces
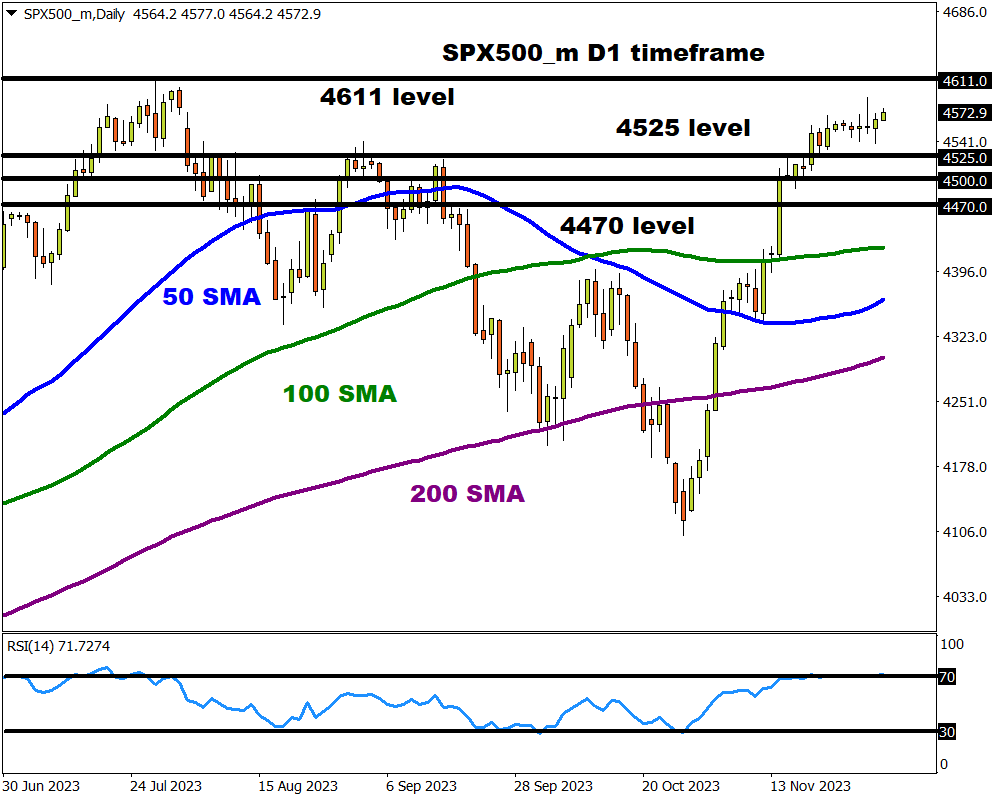
The SPX500_m remains in a bullish channel on the daily charts with prices trading above the 50, 100, and 200-day SMA. Although the path of least resistance points north, the Relative Strength Index (RSI) remains around 70 – suggesting that prices are heavily overbought. A technical rebound could be a possibility before bulls return to the driving seat.
- The support at 4525 could provide bulls the foundation to attack the 2023 high at 4611 and 4660 – a level not seen since January 2022.
- Should prices slip back under 4525, this may open a path back towards 4500 and 4470, respectively.
Ready to trade with real money?
Open accountChoose your account
Start trading with a leading broker that gives you more.